I purchased my first railroad stock for the Dividend Yield Passive Income Portfolio last Friday.
It was the railroad company Union Pacific (UP). Union Pacific Corporation, through its subsidiary, Union Pacific Railroad Company, provides rail transportation services in North America. The company offers freight transportation services for agricultural products, including grains and commodities, food, and beverage products; and automotive products, such as imported and exported shipments, finished vehicles, and automotive parts and materials.
I paid $154.75 per share which resulted in $1,242.92 net cost. The new stake will give me only around $25 bucks in dividend income per year. But the potential is available to get higher dividends in the upcoming years. Earnings are expected to grow by 13.68 percent of the next five years and the payout ratio is only at 30.2 percent while the long-term-debt to equity ratio is at 0.44.
 |
| Latest Portfolio Transactions (Click to enlarge) |
 |
| Portfolio Holdings Dividend Yield Passive Income I (Click to enlarge) |
 |
| Portfolio Holdings Dividend Yield Passive Income II (Click to enlarge) |
UNP is a Dividend Challenger who raised dividends over a period of seven consecutive years. The five year dividend growth rate amounts to 29.8 percent.
I believe that UNP is one of the most stabile railroads on the market. For sure, stocks like NSC, ARII or CSX pay better dividends but the quality is not the same and debt ratios of them are also a bit higher.
The current yield amounts to 2.04 at a forward P/E of 14.14. For the estimated growth a current P/E of 17.61 for the biggest player in the market is ok in my view.
--------------------------------------
For readers who are new to the matter and my dividend growth philosophy: I funded a virtual portfolio with 100k on October 04, 2012 with the aim to build a passive income stream that doubles each five to ten years. I plan to purchase each week one stock holding until the money is fully invested. The total number of constituents is expected at 50 – 70 companies and the dividend income should be at least at $3,000 per year.
--------------------------------------
The stock holdings are up 7.63 percent since the date of funding. In addition, I received around $1,000 in cash dividends. Due to the slow purchase process and high amount of cash since October 2012, the full portfolio is only up 6.34 percent.
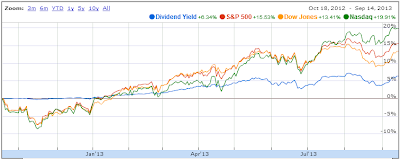 |
| Portfolio Performance (Click to enlarge) |
The full year dividend income is now estimated at $2,416.32 annualized. With a yield on cost of 3.44 percent it’s still possible to hit the mark of at least $3,000 per year despite the fact that the current trade is far below this ratio.
Here is the income perspective of the portfolio
Sym | Name | P/E Ratio | Dividend Yield | Buy | # Shrs | Income | Value |
TRI | | 26.38 | 3.74 | 28.90 | 50 | $64.75 | $1,736.00 |
LMT | Lockheed Martin C | 14.19 | 3.64 | 92.72 | 20 | $92.00 | $2,545.00 |
INTC | Intel Corporation | 12.23 | 3.98 | 21.27 | 50 | $45.00 | $1,172.00 |
MCD | McDonald's Corpor | 17.79 | 3.17 | 87.33 | 15 | $46.20 | $1,460.25 |
WU | Western Union Com | 11.68 | 3.24 | 11.95 | 100 | $60.00 | $1,841.00 |
PM | Philip Morris Int | 16.77 | 3.99 | 85.42 | 20 | $68.78 | $1,755.60 |
JNJ | Johnson & Johnson | 19.76 | 2.85 | 69.19 | 20 | $50.80 | $1,771.40 |
MO | Altria Group Inc | 15.79 | 5.21 | 33.48 | 40 | $72.00 | $1,393.60 |
SYY | Sysco Corporation | 19.54 | 3.4 | 31.65 | 40 | $44.40 | $1,315.20 |
DRI | Darden Restaurant | 15.38 | 4.25 | 46.66 | 30 | $61.50 | $1,451.10 |
CA | CA Inc. | 13.31 | 3.28 | 21.86 | 50 | $50.00 | $1,519.50 |
PG | Procter & Gamble | 20.27 | 2.97 | 68.72 | 25 | $58.20 | $1,976.25 |
KRFT | Kraft Foods Group | 17.48 | 3.69 | 44.41 | 40 | $80.00 | $2,169.60 |
MAT | Mattel Inc. | 18.64 | 3.35 | 36.45 | 40 | $55.60 | $1,681.20 |
PEP | Pepsico Inc. Com | 18.82 | 2.77 | 70.88 | 20 | $44.20 | $1,606.40 |
KMB | Kimberly-Clark Co | 20.17 | 3.34 | 86.82 | 15 | $47.55 | $1,435.35 |
COP | ConocoPhillips Co | 11.47 | 3.88 | 61.06 | 20 | $52.80 | $1,383.80 |
GIS | General Mills In | 17.52 | 2.8 | 42.13 | 30 | $41.10 | $1,477.50 |
UL | Unilever PLC Comm | 18.29 | 3.46 | 39.65 | 35 | $47.01 | $1,375.15 |
NSRGY | NESTLE SA REG SHR | 18.27 | 3.29 | 68.69 | 30 | $65.31 | $2,007.00 |
GE | General Electric | 17.65 | 3.1 | 23.39 | 65 | $48.10 | $1,545.70 |
ADP | Automatic Data Pr | 25.7 | 2.35 | 61.65 | 25 | $43.50 | $1,852.25 |
K | Kellogg Company C | 23.03 | 2.96 | 61.52 | 25 | $44.50 | $1,516.00 |
KO | Coca-Cola Company | 20.24 | 2.85 | 38.83 | 40 | $43.80 | $1,547.60 |
RTN | Raytheon Company | 13.4 | 2.71 | 57.04 | 20 | $42.00 | $1,569.60 |
RCI | Rogers Communicat | 11.2 | 4.04 | 46.5 | 50 | $84.00 | $2,092.50 |
GPC | Genuine Parts Com | 18.07 | 2.62 | 77.06 | 20 | $42.12 | $1,596.00 |
TSCDY | TESCO PLC SPONS A | 236 | 3.89 | 17.08 | 110 | $75.68 | $1,951.18 |
APD | Air Products and | 22.57 | 2.55 | 85.71 | 15 | $40.50 | $1,592.25 |
GSK | GlaxoSmithKline P | 19.49 | 4.63 | 52.16 | 30 | $71.13 | $1,542.30 |
WMT | Wal-Mart Stores | 14.39 | 2.45 | 79.25 | 20 | $36.16 | $1,487.20 |
BTI | British American | 15.99 | 3.99 | 111.13 | 23 | $96.14 | $2,425.58 |
CHL | China Mobile Limi | 10.88 | 4.03 | 55.32 | 25 | $55.95 | $1,403.75 |
MMM | 3M Company Common | 18.5 | 2.11 | 110.27 | 15 | $37.43 | $1,779.00 |
TUP | Tupperware Brands | 18.05 | 2.33 | 80.98 | 15 | $29.40 | $1,275.00 |
IBM | International Bus | 13.54 | 1.89 | 197.09 | 16 | $57.60 | $3,074.72 |
HAS | Hasbro Inc. | 18.8 | 3.27 | 44.09 | 30 | $45.60 | $1,404.60 |
T | AT&T Inc. | 26.32 | 5.21 | 34.47 | 30 | $53.70 | $1,029.60 |
WAG | Walgreen Co. Comm | 23.31 | 2.14 | 44.25 | 30 | $34.20 | $1,603.80 |
AFL | AFLAC Incorporate | 8.46 | 2.3 | 59.39 | 20 | $28.00 | $1,220.80 |
TGT | Target Corporatio | 15.45 | 2.36 | 68.69 | 32 | $48.32 | $2,040.32 |
CSCO | Cisco Systems In | 13.06 | 2.55 | 25.12 | 90 | $55.80 | $2,188.80 |
DE | Deere & Company C | 9.55 | 2.33 | 84.11 | 15 | $29.10 | $1,237.35 |
RGR | Sturm Ruger & Co | 12.36 | 3.3 | 51.65 | 20 | $38.52 | $1,189.40 |
LO | Lorillard Inc Co | 13.54 | 4.99 | 42.3 | 30 | $65.00 | $1,320.60 |
UNP | Union Pacific Cor | 17.65 | 1.85 | 154.75 | 8 | $22.88 | $1,238.00 |
|
|
|
|
|
|
|
|
|
|
|
|
|
| $2,416.32 | $75,796.80 |
|
|
|
|
|
|
|
|
|
|
|
|
|
| Average Yield | 3.19% |
|
|
|
|
|
|
|
|
|
|
|
|
|
| Yield On Cost | 3.44% |
 International Dividend Achievers stock list with high predicted earnings per share growth for the mid-term originally published at long-term-investments.blogspot.com. Dividend growth investors like you or me should always have a focus on stocks from abroad. It diversifies your portfolio and gives you more opportunities from different countries.


